Additive Manufacturing (AM), in particular metal AM, has introduced an interesting new paradigm in manufacturing and subsequently a lot of research effort has been devoted to understanding the process. As a newer technology, the main barrier to acceptance that I witness is the large, dark cloud of uncertainty around the process and more pointedly towards the exact quality of components made using this technology. To demonstrate, I present a possibly silly analogy related to steel making. In steel making, a single crucible yields many tons of metal which in its entirety requires one qualification. From verifying chemistry, to defect identification, all the way to final dimensional checks of the finished plate, casting, etc. This is an intensive process but the industry has scaled in such a way that a whole bunch of finished products are produced from the effort. Conversely, in metal AM every point in the component space requires qualification due to the unique process conversion of raw material to molten material and back to solid state; Every point in an AM component is a small-scale crucible and as such is subject to all the same quality requirements as traditional steel making. If this thought portrays AM as daunting, well, frankly it is. There is some upshot to solving this problem though, which is access to all the blue-sky use cases that have been widely popularized around AM. So where does in-situ monitoring and pseudo-observables enter into the equation?
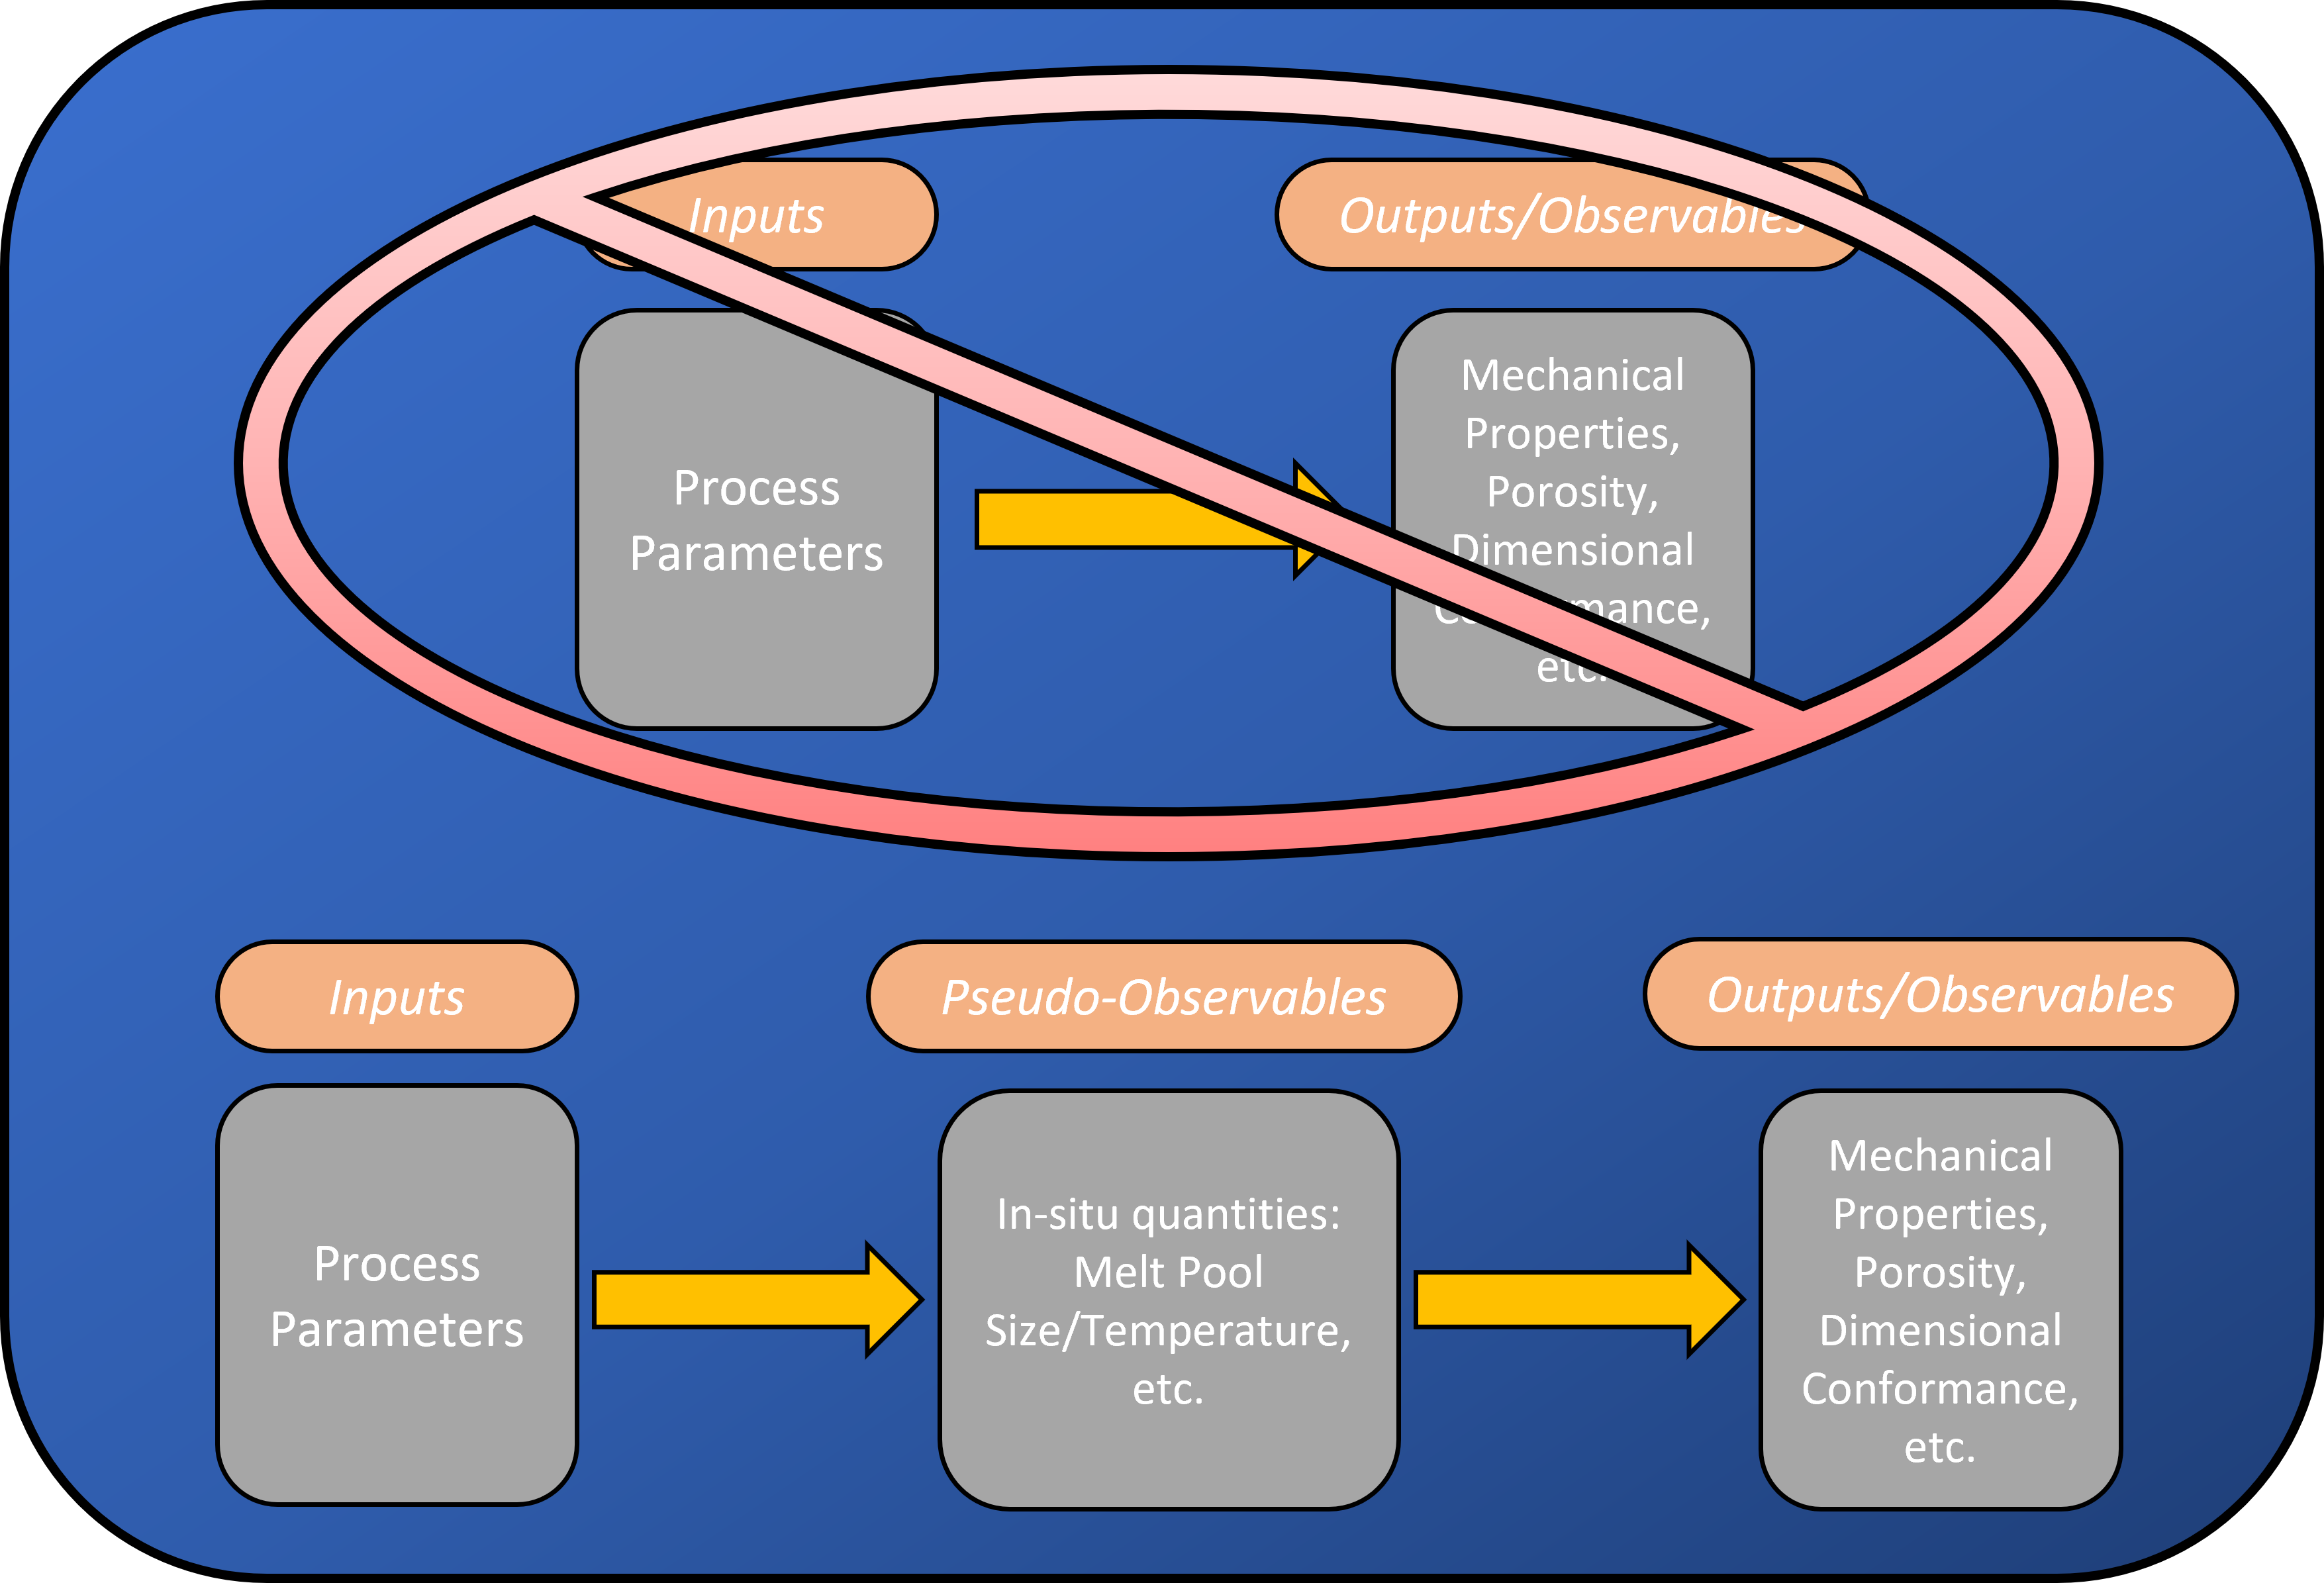
Figure 1 attempts to illustrate the current state of how to address and guarantee quality assurance in AM. The top of figure shows the traditional, industrial paradigm where an industrial process is dissected into all of its relevant process variables, those variables then become tightly controlled, and then a functional relationship can be directly drawn between the inputs to the process and the final outcomes. This paradigm has served society extremely well and applies to a large majority of consumer goods. Naively, we applied this methodology to AM expecting business-as-usual and we’d be one step closer to the Jetson’s. We were wrong. The process inputs simply do not capture the whole story with respect to the finished component. There continues to be research into augmenting the inputs to better suit AM. Examples of this include refined alloy chemistries, and specialty heat sources (laser wavelength or shape). These will continue to be part of the story, however, as presented in the bottom of Figure 1, another means of achieving process improvements is through the introduction of in-situ monitoring. In-situ monitoring is very in vogue these days with most AM machine manufacturers implementing some form of process monitoring and a host of literature created by the research community. In general though, both industry and academia have not found the secret sauce yet when it comes to in-situ monitoring. I would like to pull at this thread and explore a bit.
Since in-situ monitoring uses sensors and generates signals and a fair amount of data, I tend to cast it in terms of data science. Therefore I will use the term pseudo-observable interchangeably with in-situ monitoring. As shown in Figure 1, I see the AM process consisting of Inputs, which then generate Pseudo-observables, and this then leads to the Observables of the final state, or condition.
If in-situ monitoring/pseudo-observables has/have value, what, if any, general bounds can be placed on the value of that information? Right now the additive community places sensors which we all believe are pertinent to the process and therefore explicative. Typically it is some combination of optical thermography and tomography sensors that have become the de facto standard sensors, but researchers are still trying more non-conventional sensors. To me this begs the question of what quality of information is required of in-situ monitoring? If no reliable relationship can be formulated from inputs to observables, what sort of distribution is needed as an intermediary so that inputs can describe the pseudo-observable signature and then the pseudo-observables can then reliably describe the observables? In one way this could be analogized as a coordinate transformation, or mapping, and in another way as “learning” the latent space in the case of Generative Adversarial Networks (GANs) [1].
Terrence Tao has also written about the transitivity of correlations of distributions and that in general it just…depends. He is a very intelligent authority on these issues and I’m just hopeful that I walked away with the correct comprehension. He does expound on a couple of situations where this holds and I’ve linked his blog [2] if anyone wants to read further.
I am interested in what the salient structures are in a pseudo-observable distribution. The thought of utilizing that structure and basically plugging in a sensor that meets those requirements is enticing if not a complete flight of fancy. Reality of this situation is most likely much dirtier and noisier than that. Regarding this pseudo-observable distribution, I do think that having at least an inkling of structure would be helpful to the additive field moving forward. Understanding that distribution helps with the following question of what sensor and sensor signature is required. Is there such a thing as one “correct” sensor or is it about leveraging a suite of them? From this sensor(s), should we consider feature engineering and transforming those raw signatures into novel, combined parameters or is the raw signature all that is needed? These are open questions but I see this problem as requiring a suite of sensors and both the raw and augmented signatures. I realize that I am avoiding an answer in ways because I’ve declared that “all of the above” is needed but take these next points as my evidence.
Low hanging fruit supporting feature engineering is the extensive history and use of combined parameters like power density, linear heat input, etc. for comparison and prediction within the additive community and research. These combined parameters are typically based on inputs only, but in the case of an energy density, the laser spot size could easily be swapped with the instantaneous melt pool size making the quantity based on inputs and pseudo-observables. An example from my own research, supporting both feature engineering and multiple sensors, shows that melt pool size and melt pool temperature as a combined quantity is a strong indicator of large defects and geometric deviation in DED. Meaning that this quantity reveals whether material was present from the previous layer to build upon. This results simply from multiplying the signatures together and I believe that further feature engineering, possibly a polynomial combination, could increase the sensitivity enough to detect smaller defects.
It is with that I will cut off this first blog about in-situ monitoring. The more time I spend researching this subject the more interesting rabbit holes I find myself tumbling down. Some of which will make it into future posts, but not this one as I could easily continue rambling. My plan is that future blogs will include some analysis and will hopefully start teasing apart these ideas. Most likely will also raise a bunch of new ones. Until then, Cheers!
References
[1] V.A.P. Arseny, GAN learning visualization • R-seny, (2018). http://r-seny.com/2018/12/05/gan-learning-visualization/.
[2] When is correlation transitive?, (2014). https://terrytao.wordpress.com/2014/06/05/when-is-correlation-transitive/.
